
With COP26 in Glasgow approaching, we at iDelta have started to take a look at what changes we can make to reduce our impact on the environment. One simple change we have been looking at is using smart plugs and Splunk to monitor (and reduce) our energy consumption. Of course, with UK energy prices rising rapidly this could also save us some £££s.
You’ll need:
- TP-Link KP115 Kasa Smart WiFi Plug Slim with Energy Monitoring – (available on Amazon),
- python-kasa library,
- and Splunk (of course)!
Getting Set Up
Follow the included instructions to get the KP115 up and running. At this point, you can use the app to view real time and cumulative information on energy consumption.


This is great if you want to see what is happening as it happens. But, if you want to monitor your energy use throughout the day, you’ll need a little bit of Splunk magic.
Get at the data
Before we can do this, we need to get hold of the data. This is where the python-kasa library comes in. This library enables us to control, and get data from, a variety of TP-Link devices using Python.
To install this library, make sure you have Python3 (which should include Pip3). Use the following command in your shell:
pip3 install python-kasa Once this has installed, use kasa discover to locate your smart plug:
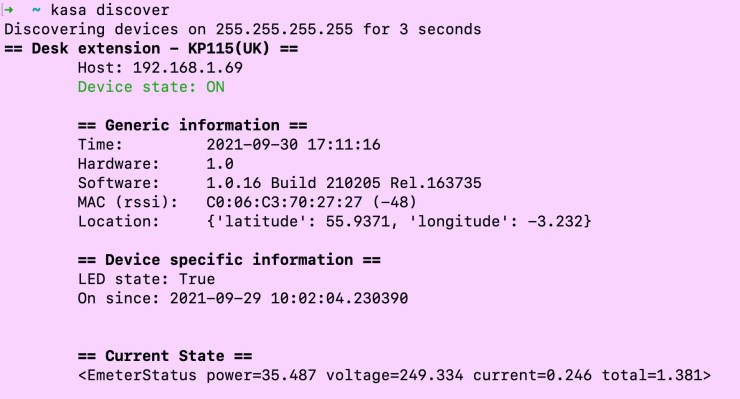
This shows information about your plug, including when it was turned on, and what power it is using. Make a note of the Host name, as you will need this for the next step. The python-kasa library works with Kasa branded power strips, bulbs and plugs, and comes with commands to allow you to turn them on or off, to change the colour, temperature or brightness of bulbs, or to get various details about the devices.
Use the following command to get more information on your plug’s energy usage:
kasa --host [YOUR HOSTNAME] --plug emeterWhich should give you an output like this:
== Emeter ==
Current: 0.283 A
Voltage: 249.504 V
Power: 42.651 W
Total consumption: 1.39 kWh
Today: 0.256 kWh
This month: 1.39 kWh
All we need to do now is get this data into Splunk!
Get the data into Splunk
To get the data into Splunk, you’ll need to create a bash script containing the above command, and an inputs.conf file to tell Splunk to run it.
Before doing these steps, make sure to create an index in Splunk – we called ours kasa but you might have different naming conventions.
Navigate to /$SPLUNK_HOME/etc/apps and create a directory for your app (we called ours kasa). Within that directory, you’ll need a bin directory and a default directory.
In the kasa/bin directory, create a new file called kasa-emeter.sh. This will be a bash script that contains the emeter command from above, as follows:
#!/bin/bash

#run kasa emeter command with hostname of specific plug
kasa --host [YOUR KASA HOST] --plug emeter
Make sure that this file is executable (chmod u+x kasa-emeter.sh).
In the kasa/default directory, create a new file called inputs.conf. This is the file that tells Splunk to run the script you’ve created. You’ll need to make some changes, according to your environment – pay particular attention to the script path. We’ve set the polling interval at 60 seconds, as this should give us enough information.
[script://$SPLUNK_HOME/etc/apps/kasa/bin/kasa-emeter.sh]
disabled=false
host=[YOUR_KASA_HOST]
index=kasa
interval=60
source=kasa
sourcetype=kasa_data
Restart Splunk, and you should see data appearing in the index you’ve created and specified.

Look out for part 2, where we will work with this data to create a dashboard to monitor our energy usage.
For 2021 we’ve committed to posting a new Splunk tip every week!
If you want to keep up to date on tips like the one above then sign up below:
Subscribe to our newsletter to receive regular updates from iDelta, including news and updates, information on upcoming events, and Splunk tips and tricks from our team of experts. You can also find us on Twitter and LinkedIn.